Welcome to Our Services Page

πŸ’‘ Most businesses are drowning in scattered, messy, and overwhelming data. Sales, marketing, finance, operations, customer feedback β€” it all sits in different files, tools, and systems. This makes it hard to see the real picture and take quick, confident decisions.

πŸš€ That’s where I step in. I specialize in Data Analytics, Power BI Dashboards, and Automation β€” transforming raw data into interactive dashboards that uncover insights, save time, and help you act faster.

Whether you need Sales & Marketing dashboards, Financial reports, Operations tracking, or Industry-specific solutions, I’ve built dashboards across multiple domains for startups, enterprises, and agencies worldwide.

πŸ‘‰ Browse through my service packages below and choose what fits your business needs.

MY DATA PACKAGES

Ready to unlock insights from your data? πŸ“Š DM me on WhatsApp to get started today!

🟒 Basic – Starter Dashboard

πŸ’° Starts at 250$+
Title: Essential Operations Snapshot
Description:

  • 1 Dashboard (choose: Inventory OR Logistics OR Workforce)

  • Single dataset (Excel/CSV/Google Sheets)

  • 3–4 Core KPIs (Stock Levels, Orders, Cost, Utilization)

  • Clean tables & charts for easy tracking

  • Delivery: 5 days

  • 1 Revision

πŸ‘‰ Best for small operations teams who want to track basics without complexity.

πŸ”΅ Standard – Multi-Operations Dashboard

πŸ’° Starts at 400$+
Title: Integrated Operations Dashboard
Description:

  • Up to 2 Dashboards (e.g., Inventory + Logistics, or Logistics + Workforce)

  • Multiple data sources (Excel, Google Sheets, SQL, ERP extract)

  • 6–8 KPIs (Inventory Turnover, Fulfillment Time, Logistics Cost, Workforce Productivity)

  • Interactive features: Filters, Drilldowns, Slicers

  • Delivery: 7–10 days

  • 2 Revisions

πŸ‘‰ Best for medium businesses needing deeper visibility across supply chain & operations.

🟣 Premium – End-to-End Supply Chain Intelligence

πŸ’° Starts at1200$+
Title: Advanced Operations & Logistics Suite
Description:

  • Full dashboard suite (Inventory + Logistics + Workforce)

  • Multiple integrations (ERP, SQL, Cloud, Excel)

  • 10+ KPIs (Stockout Risk, Delivery Time, Cost per Shipment, Workforce Utilization, Efficiency Ratios)

  • Advanced features: Bookmarks, Tooltips, Forecasting

  • Business-ready polished design & storytelling visuals

  • Delivery: 14–21 days

  • Unlimited Revisions (within scope)

πŸ‘‰ Best for enterprises wanting complete supply chain intelligence to cut costs and optimize performance.

🟒 BASIC – Starter Insights

Title: Essential Sales & Marketing Snapshot
Description: Perfect for small businesses or individuals who need a quick, clean, and easy-to-use dashboard. I’ll take your raw dataset, clean it, and transform it into a simple 1–2 page dashboard in Excel or Power BI with essential KPIs.

πŸ’° Starts at150$+

  • Data cleaning & preparation (up to 1 dataset)

  • One simple dashboard or Max 2 page (E-commerce, Marketing, OR CRM) in Power Bi or Excel or Looker Studio

  • Data integration from a single source (e.g., Shopify OR Google Analytics OR Excel)

  • Core KPIs: Revenue, Orders, AOV, Conversion Rate, Leads

  • Clean, easy-to-use layout

  • 3 Key Metrics/KPIs tracked

  • Delivery: 5 days

  • 1 Revision

πŸ‘‰ Best for small businesses who want a quick overview of their performance.

πŸ”΅ STANDARD – Business Ready Dashboard

Title: Multi-Channel Growth Dashboard
Description: Ideal for growing businesses that need deeper insights. I’ll connect multiple data sources (Excel, Google Sheets, SQL), build a professional 5-page interactive Power BI dashboard, and set up automated recurring reports so you never have to worry about manual updates.

πŸ’° Starts at 300$+

  • Multiple data sources integration (Excel, Google Sheets, SQL, etc.)

  • Interactive Power BI dashboard (up to 5 pages)

  • Data integration from multiple sources (e.g., Shopify + Google Ads, CRM + Facebook Ads, etc.)

  • Data Modelling(Star Schema Model)

  • Interactive features: Filters, Drilldowns, Tooltips

  • 8–10 KPIs with filters & slicers

  • Automation setup for recurring reports

  • Delivery: 7–10 days

  • 2 Revisions

πŸ‘‰ Best for growing businesses that want deeper insights across sales & marketing channels.

🟣PREMIUM – Advanced BI & Automation

Title: All-in-One Sales, Marketing & CRM Intelligence

Description: Designed for companies that want a complete business intelligence setup. From financial and sales dashboards to advanced drilldowns, tooltips, and cloud integrations, I’ll deliver a powerful analytics solution with automation and a presentation to guide your business decisions.

πŸ’° Starts at 1000$+

  • End-to-End Business Intelligence solution

  • Complete dashboard suite (E-commerce + Marketing + CRM)

  • Multiple data sources integrated (Shopify, Amazon, WooCommerce, GA, Ads, CRM)

  • Custom KPIs tailored to your business goals

  • Advanced features: Bookmarks, Drillthrough, DAX Measures, Automation

  • Polished design with storytelling visuals

  • Advanced dashboards (10+ pages, cross-report drilldowns, tooltips)

  • Real-time automation with cloud/database integration

  • Business insights presentation + storytelling

  • Delivery: 14–21 days

  • Unlimited Revisions (until scope is met)

🟒 Basic – Starter Dashboard

Price: Starting at $300
Title: Essential Industry Insights
Includes:

  • 1 Dashboard (choose Real Estate OR Healthcare OR Hospitality)

  • Single dataset (Excel/CSV/Google Sheets)

  • 3–4 Key KPIs (e.g., Property Occupancy, Patient Compliance Rate, Event Bookings)

  • Simple, clean visuals

  • Delivery: 5–7 days

  • 1 Revision

πŸ‘‰ Best for small businesses or individuals who need a focused, industry-specific snapshot.

πŸ”΅ Standard – Multi-View Dashboard

Price: Starting at $700
Title: Comprehensive Industry Dashboard
Includes:

  • 2 Dashboards (e.g., Real Estate + Hospitality, or Healthcare multi-page view)

  • Multiple data sources (Excel, CRM, Google Sheets, SQL)

  • 6–8 KPIs (e.g., Lease Expiry Tracking, Compliance Trend, Event ROI)

  • Interactive features: Filters, Drilldowns, Tooltips

  • Delivery: 7–10 days

  • 2 Revisions

πŸ‘‰ Best for mid-size organizations needing deeper insights and automation.

🟣 Premium – Advanced Industry Intelligence

Price: Starting at $1,500+
Title: End-to-End Industry BI Solution
Includes:

  • Complete dashboard suite (Real Estate + Healthcare + Hospitality, or full multi-page industry solution)

  • Multiple integrations (CRM, SQL, ERP, Cloud data)

  • 10+ KPIs tailored to industry goals

  • Advanced features: Forecasting, Drillthrough, Bookmarks, Automation

  • Business storytelling visuals for decision-making

  • Delivery: 14–21 days

  • Unlimited Revisions (within scope)

πŸ‘‰ Best for enterprises and organizations that need an industry-specific BI ecosystem for long-term growth.

🟒 Basic Package – Data Connect Starter

Description:
Set up a single source automation (e.g., Excel β†’ Power BI) with basic data cleaning and scheduled refresh.

  • Scope: 1 Data Source (Excel/CSV) β†’ Power BI

  • Delivery: 3 days

  • Revisions: 1

  • Cost: $150

🟑 Standard Package – Smart Data Sync

Description:
Integrate multiple data sources (Excel + SQL/Database OR Google Analytics) into Power BI with auto-refresh and basic KPIs.

  • Scope: Up to 2 Data Sources

  • Features: Scheduled Refresh, Basic Transformations, 1 Dashboard with Key Metrics

  • Delivery: 5 days

  • Revisions: 2

  • Cost: $300

πŸ”΅ Premium Package – Advanced Data Automation Suite

Description:
End-to-end data automation & integration: combine 3+ data sources (Excel, SQL, Google Analytics, CRM, etc.), advanced data modeling, KPI tracking, and automated reporting.

  • Scope: 3+ Data Sources

  • Features: Complex Transformations, Advanced Power Query, Custom Dashboards, Automated Refresh & Alerts

  • Delivery: 7–10 days

  • Revisions: 3

  • Cost: $600

Our Data Services

Interactive dashboards and insightful reports tailored to your data needs.

A person is viewing a map with red data points on a computer monitor, likely indicating a geographical distribution. The image has a focus on technology and data analysis.
πŸ” Data Analysis Services
  • Business Data Analysis (Sales, Marketing, Financial, HR, etc.)

  • KPI & Metric Identification and Optimization

  • Exploratory and Statistical Data Analysis

  • Trend, Pattern & Root Cause Analysis

  • Forecasting and Predictive Insights (Basic Level)

  • Maintaining Data and Protection
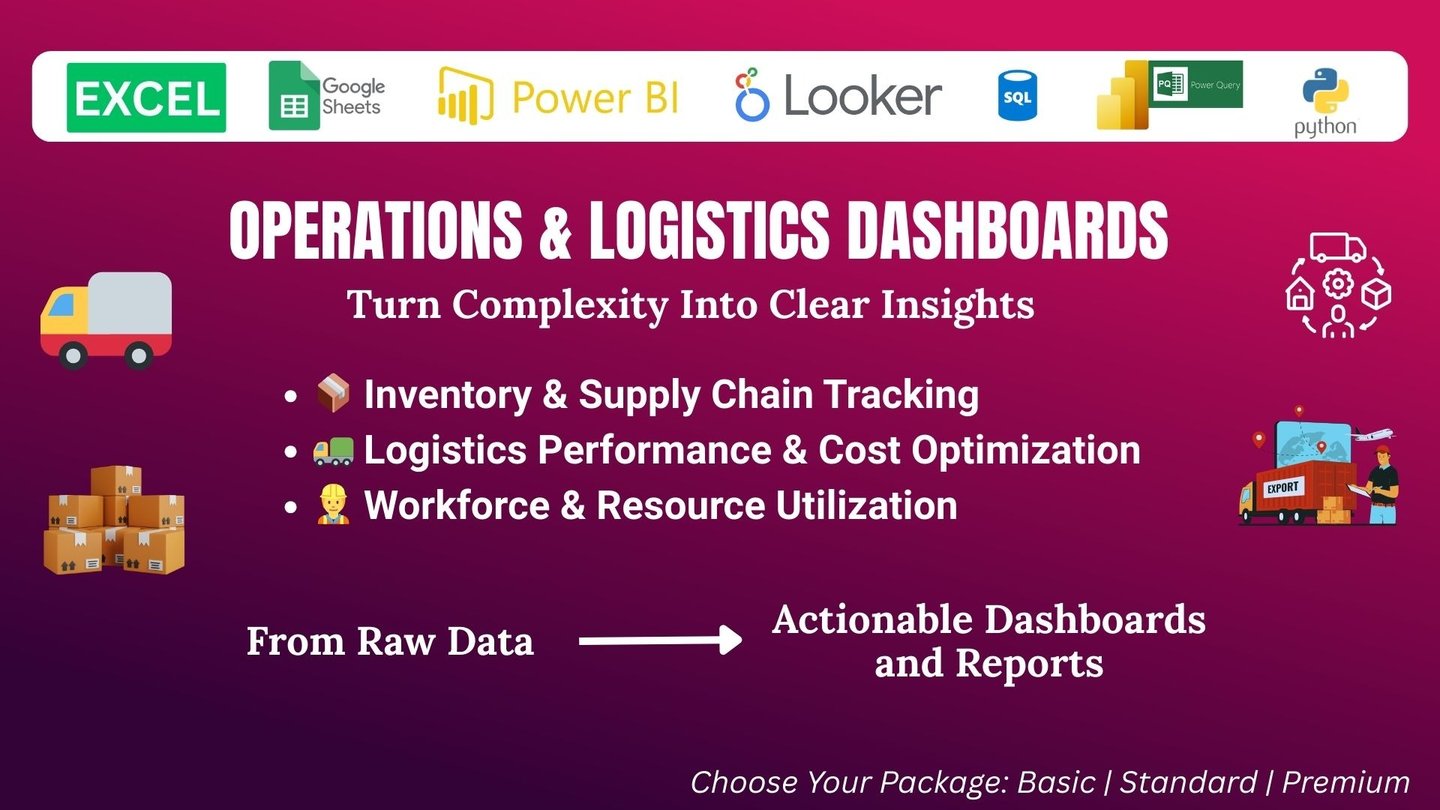
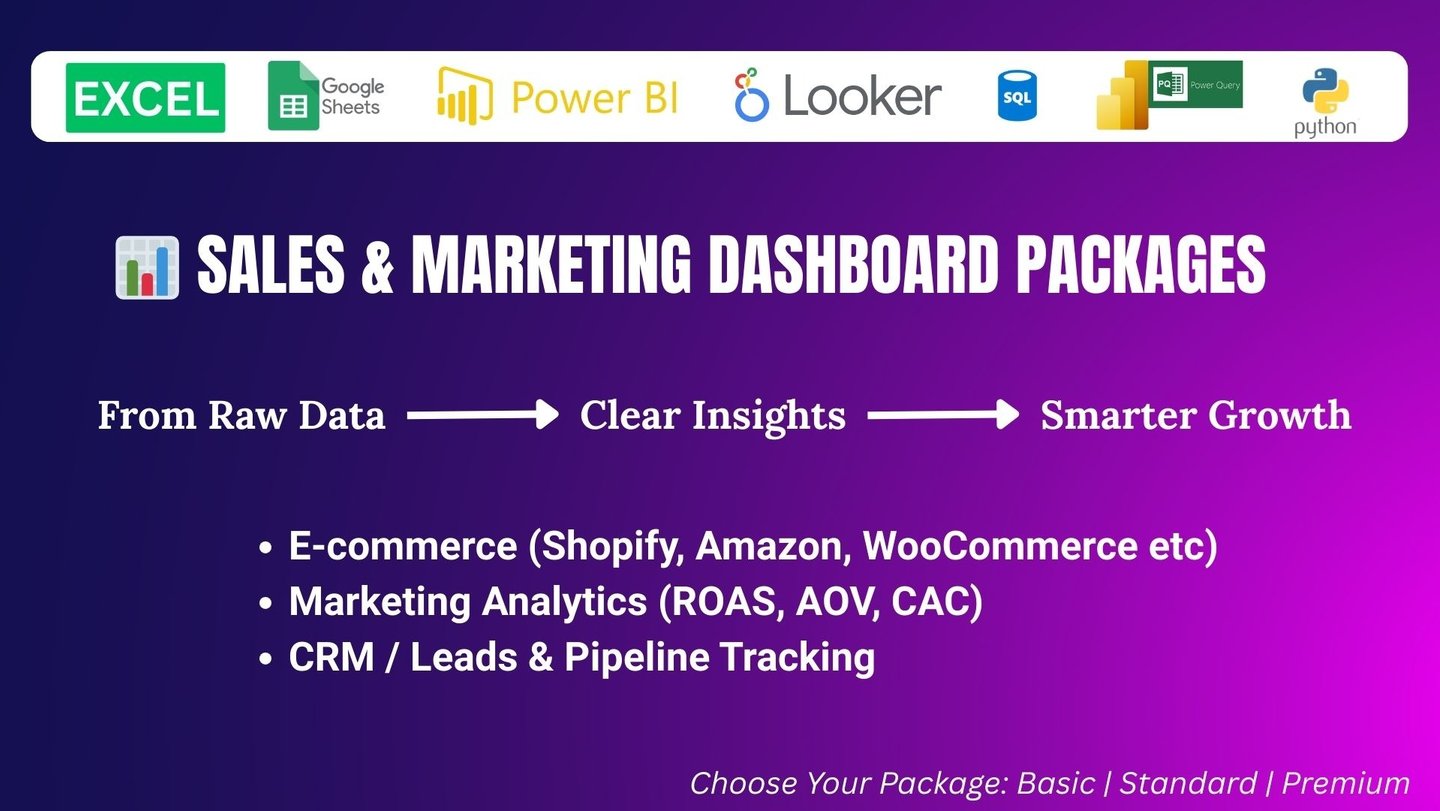
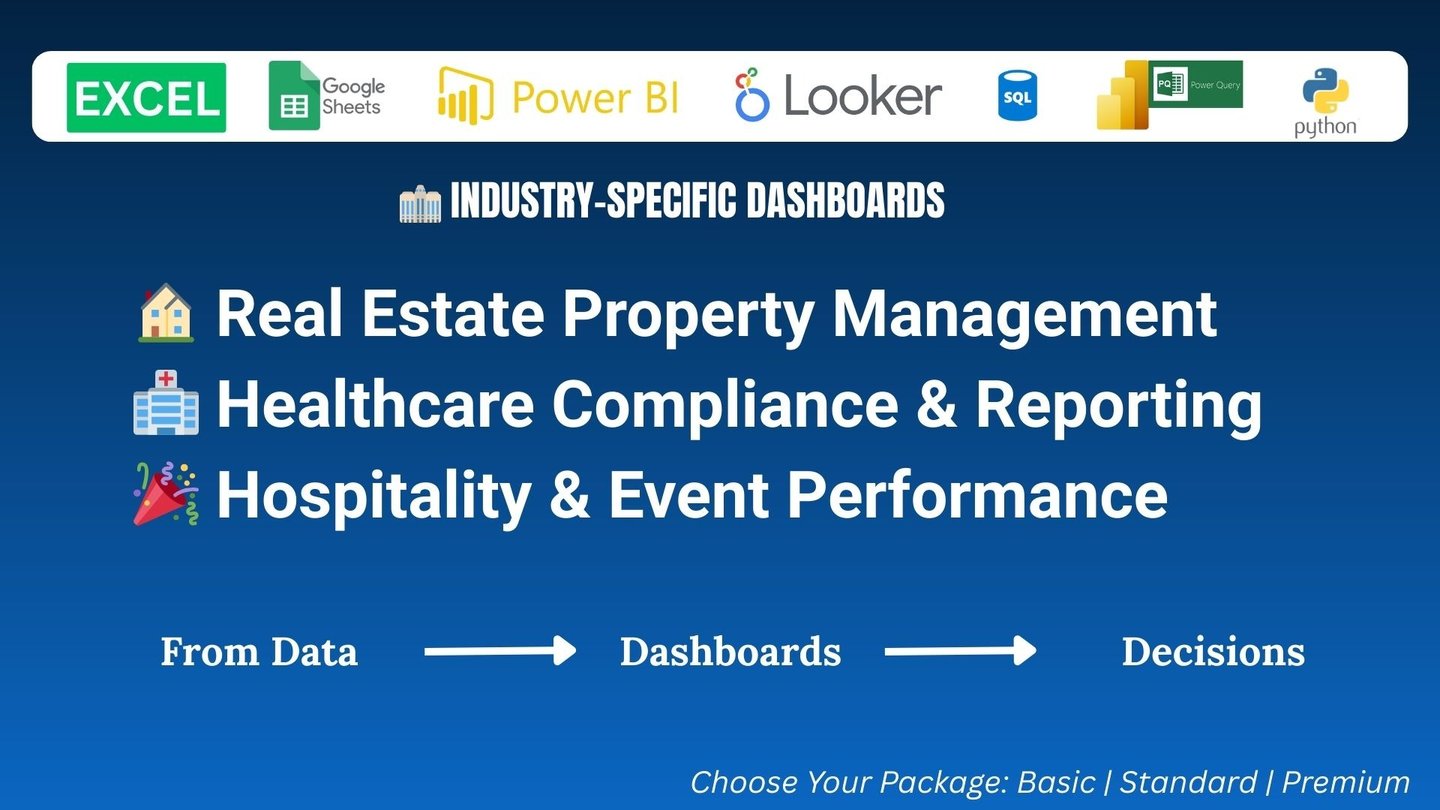
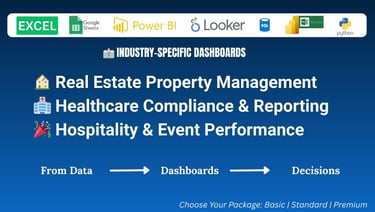
πŸ“Š Dashboard & Report Development
  • Interactive Power BI Dashboard Creation

  • Excel Dashboard Creation (with Power Query & Pivot)

  • Google Sheets Dashboard Setup

  • Looker Studio Report Building

  • Cross-platform Dashboard Integration

  • Executive Summary Dashboards

  • E-commerce Analytics Dashboards

  • HR, Finance, Logistics, and Healthcare Dashboards

πŸ› οΈ ETL & Data Preparation
  • Data Cleaning & Preprocessing

  • Power Query Transformation Workflows

  • Data Modeling & Relationship Management

  • DAX Calculations & Custom Measures

  • Combining and Integrating Multiple Data Sources

☁️ Data Source Integration
  • Excel, CSV, JSON, XML, TXT files

  • SQL, MySQL, PostgreSQL, MongoDB

  • SharePoint, OneDrive, Google Sheets, Microsoft Dataverse

  • REST APIs, CRM Exports, ERP Tools

  • Snowflake, Azure, Google BigQuery (Read-Only Data)
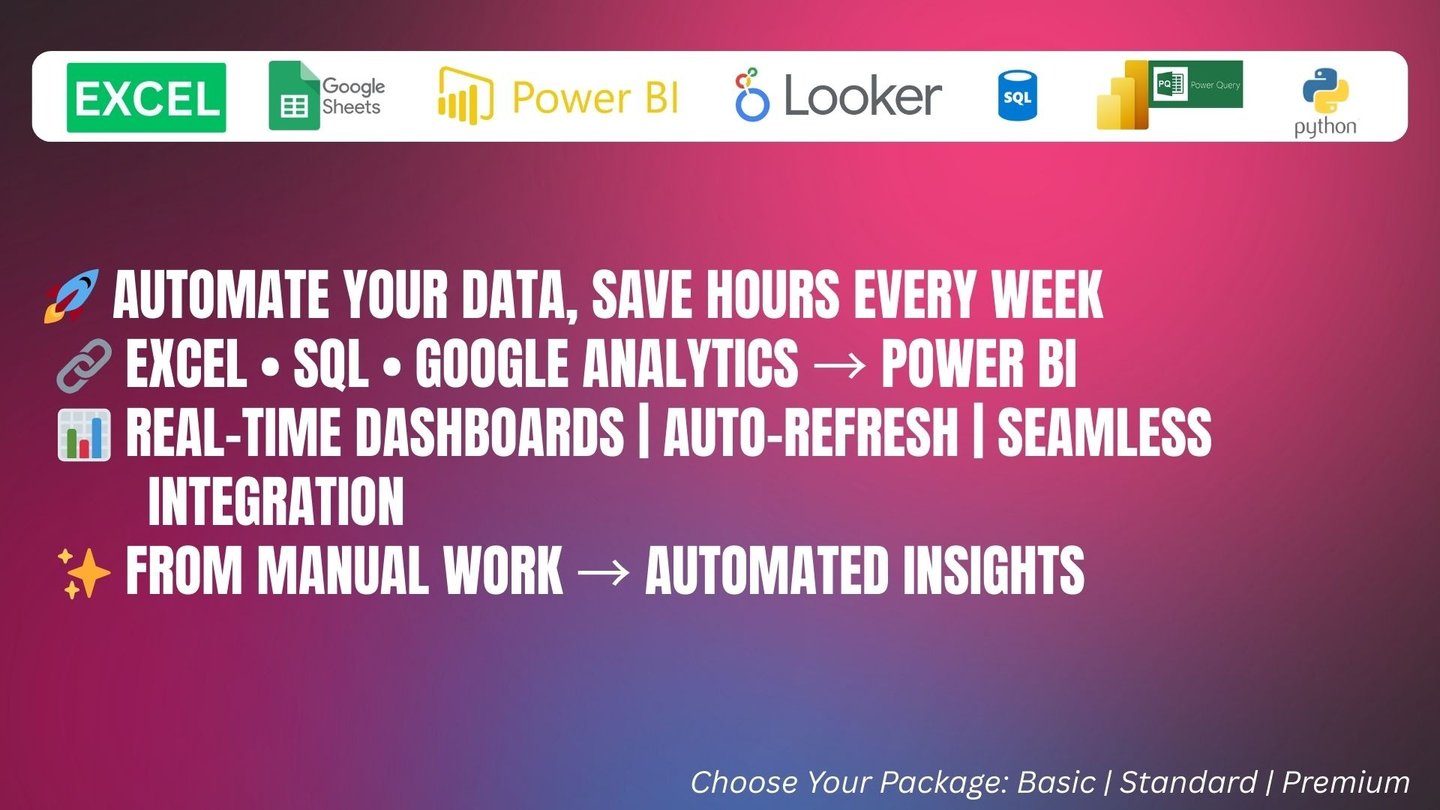
βš™οΈ Automation & Report Scheduling
  • Data Refresh Automation Setup

  • Scheduled Email Reports (Daily/Weekly/Monthly)

  • File Drop Automations & Folder Integration

  • Workflow Optimization (No-Code/Low-Code tools)

🧩 Consultation & Troubleshooting
  • One-on-One Power BI/Excel Consultation

  • Dashboard Performance Optimization

  • Troubleshooting Report Errors & Data Mismatches

  • Help with Power BI Service Setup & Deployment

  • SharePoint & Teams Power BI Integration Support

graphs of performance analytics on a laptop screen
man in blue and white plaid dress shirt using macbook pro
man using MacBook
man using MacBook